C-DRONE GUIDE · 26 JULY 2026
Urban heat islands: drone thermal mapping for local authorities
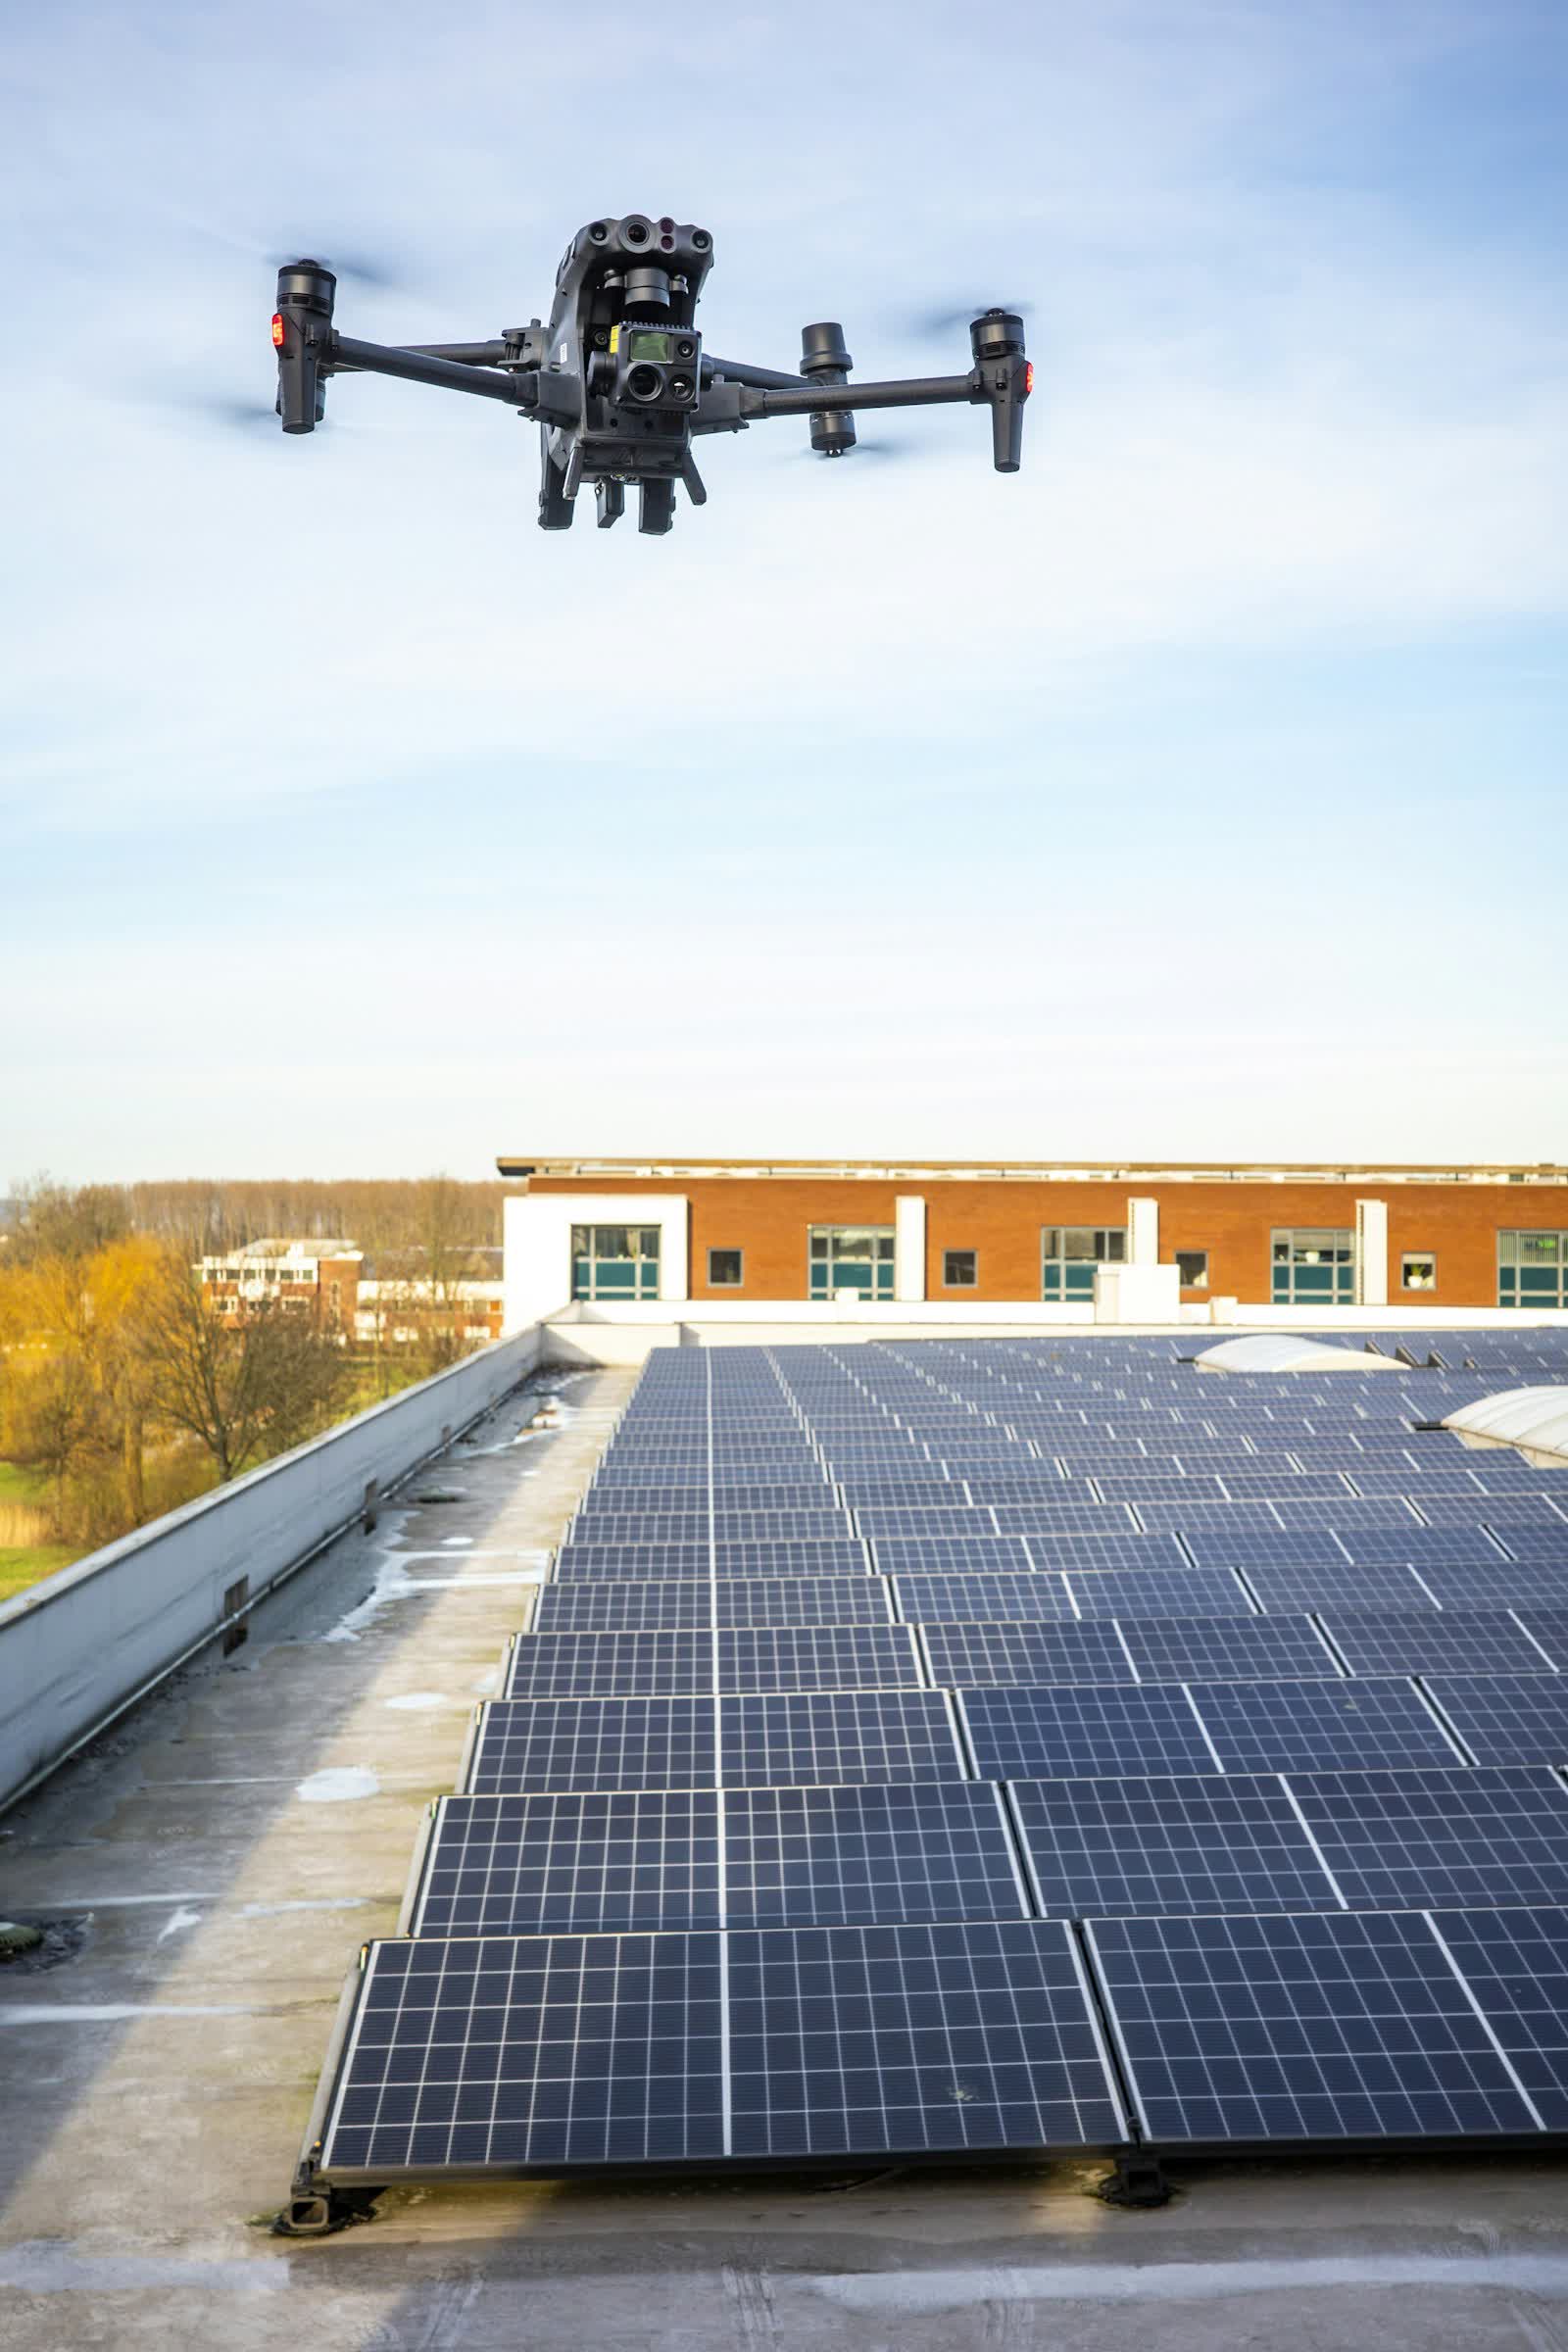
Every heatwave widens the gap: at night, a mineral city core can stay several degrees above its greener outskirts — the urban heat island, with well-documented health consequences for vulnerable people. In response, local authorities launch greening plans, de-paving of schoolyards and car parks, cool roofs. But where to act first, and how to prove the completed scheme actually cools? Satellites are too coarse for a street, weather stations see only a few points. The thermal drone fills that gap: it maps surface temperature at neighbourhood scale, with the metre-level resolution needed to compare a schoolyard, a street, a roof. Method, limits and 2026 prices.
Published on 26 July 2026, reviewed on 21 September 2026 — regulations in force as of September 2026.
What the drone measures — and what it does not
The drone's thermal camera measures surface temperature: that of asphalt, roofs, ground, canopies — not the air temperature a pedestrian feels. The two are linked: surfaces overheated by day release their heat at night and sustain the island. The surface temperature map is therefore the diagnostic tool for causes: it points to the car parks, yards, dark roofs and canyon streets that store heat, and conversely shows the measurable effect of a tree line, a permeable surface or a cool roof.
The drone's relevance for this fine-grained diagnosis is documented: a study by Naughton and McDonald published in 2019 in Remote Sensing mapped the variability of urban land surface temperatures by drone and showed how it relates to land cover at a resolution satellites cannot reach (see the study on Google Scholar). It is precisely that scale — the schoolyard, the city block — that a municipal adaptation plan needs.
A typical campaign: day, night, before, after
The most telling protocol combines two flights per situation: a mid-afternoon pass on a hot day, showing where heat accumulates, and an early-night pass, showing where it is released — the night map is what best materialises the heat island. Night flying is legally possible for a declared professional operator; in built-up areas the mission follows the usual urban flight regime (prior declaration, prefectural agreement where required) and standard GDPR care — thermal imagery at this resolution identifies nobody, but the associated visible images follow the rules of our GDPR and drones guide.
The second dimension is time: redoing the same map after the scheme — de-paved schoolyard, greened square, renovated roof — objectifies the gain in degrees, a concrete argument for funders and residents alike. A municipality can thus build a thermal observatory of its priority neighbourhoods, updated at each stage of the plan, in the spirit of the periodic municipal orthophoto.
From diagnosis to planning documents
The thermal map is not just a communication asset: it feeds regulatory and planning processes. French territorial climate plans (PCAET) include an adaptation strand where the heat-island diagnosis naturally belongs; local plan (PLU) revisions can rely on this data to locate greening obligations, biotope coefficients or design guidelines; urban renewal projects document their baseline. Georeferenced drone data overlays directly onto the cadastre and orthophotos in the authority's GIS.
The diagnosis is stronger when crossed with other layers from the same flights: the visible orthophoto for actual land cover, the digital surface model for shading, and the neighbouring uses described in our guides — district heating thermography when a warm linear anomaly crosses the map, or traffic counting when a corridor's heat raises questions about its use. A single public contract can bundle these deliverables.
Observed prices in 2026
Ranges observed in 2026 (excl. VAT):
- Thermal mapping of one neighbourhood (20 to 50 ha, day + night flights, calibrated maps): €1,500 to €3,500.
- Single site (schoolyard, square, development zone — before/after works): €600 to €1,200 per campaign.
- Multi-year observatory (same sectors reflown each summer): 20 to 30% tapering discount per recurring campaign.
A whole town is best treated by prioritised sectors rather than in one block — more useful and cheaper. These amounts fit comfortably within adaptation-plan study budgets, and the GIS deliverables are reused across departments. Our drone thermal imaging page presents the service; request a quote stating the candidate sectors and whether you run a GIS.
Put it into practice
- Drone aerial thermal imaging: rates and cities covered from €500
- Aerial thermal imaging in Ajaccio Corse
- Aerial thermal imaging in Montauban Occitanie
- Aerial thermal imaging in Hyères Provence-Alpes-Côte d'Azur