A professional drone pilot for this mission Request a free quote
C-DRONE GUIDE · 1 AUGUST 2026
Municipal solar register by drone: mapping rooftop photovoltaic potential, price
Which of the municipality's roofs deserve solar panels — and in what order? The question returns in every climate plan, every energy master plan, every budget debate on public buildings. Large metropolitan areas answer it with solar registers computed from regional aerial data; mid-sized municipalities make do with data that is sometimes old and too coarse to read a dormer, a rooftop plant room or the church tower's shadow. The drone closes that gap: one municipal photogrammetric flight yields an up-to-date 3D model, from which per-plane irradiation is derived, real shading included. Here is the method, what research has validated, and prices observed in 2026.
Published on 1 August 2026, updated on 22 September 2026 — regulations in force as of September 2026.
What a solar register is — and why the data is everything
A solar register is a map assigning each roof plane an annual irradiation (kWh/m²/year) and, by extension, an estimated photovoltaic yield. The computation itself is a solved problem: it rests on the sun's path and on a digital surface model (DSM) describing roofs, trees and masks. All the result's quality therefore comes from the DSM. A study by Jakubiec and Reinhart published in 2013 in Solar Energy, foundational to the genre, showed on Cambridge (Massachusetts) that an hourly computation on a fine LiDAR DSM predicts roof-by-roof yield reliably enough for public decision-making.
The review by Freitas, Catita, Redweik and Brito published in 2015 in Renewable and Sustainable Energy Reviews confirms the hard point: the surface model's resolution and freshness dominate every other error source — a coarse DSM smooths chimneys away, ignores trees that have grown, and manufactures potential where there is none (see the study). That is exactly what the drone flight corrects at municipal scale.
The drone method: from municipal flight to per-plane potential
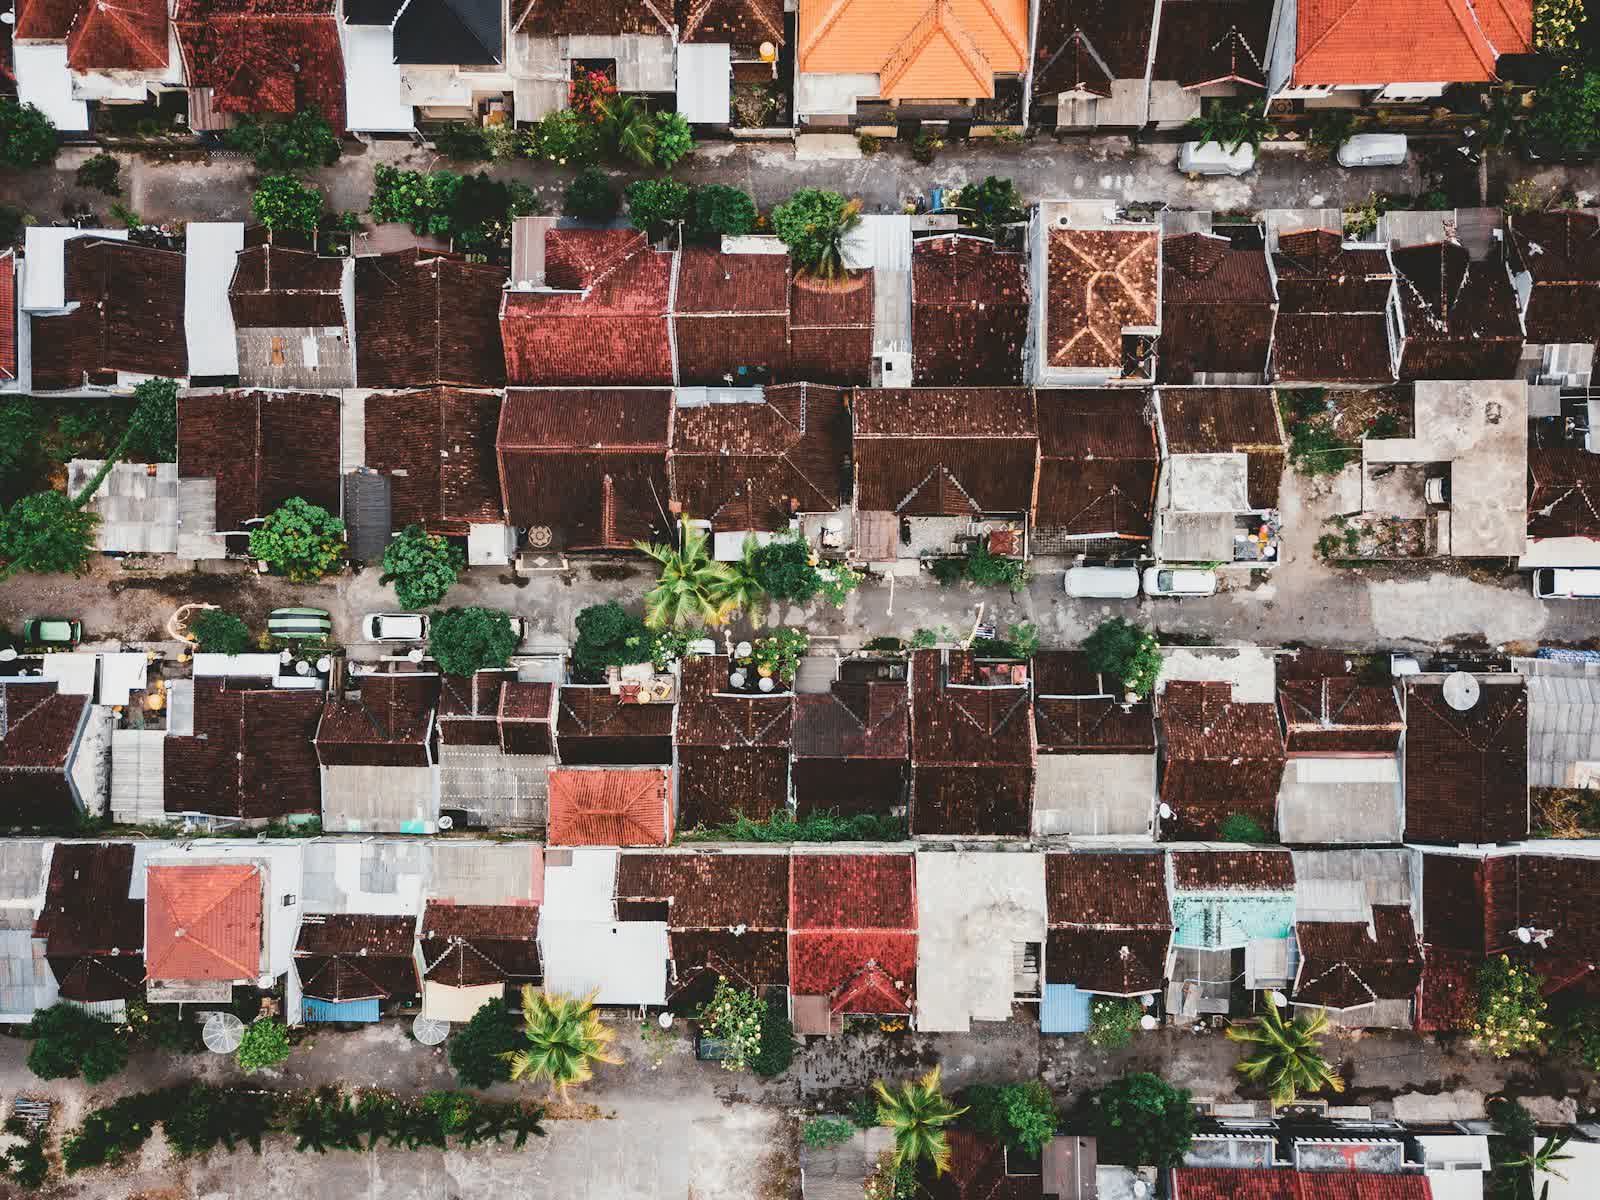
The chain is that of an augmented municipal orthophoto: photogrammetric flight over the town centre or built-up zones, production of a 5-10 cm DSM and an orthophoto, then irradiation computation with the sun's path over the year — each plane gets its usable area, orientation, pitch and real masks: the church tower, the row of plane trees, the building next door. The operational output: a GIS map queryable by building, a ranking of public roofs by yield, and sheets for the priority sites.
The drone's edge over existing regional data holds in three words: freshness (this year's buildings and vegetation), fineness (plant rooms, dormers, chimneys that condition the panels' real layout), ownership (the municipality chooses the footprint and owns the data, reusable for every other purpose of a municipal orthophoto). For an already identified site, fine shading analysis belongs to our sunlight and shading study guide.
From register to decision: public buildings and residents
The first use is asset-driven: rank school, sports hall, depot, town hall and village hall by real yield, cross-reference with roof condition — the flight that builds the DSM also documents the roofs — and assemble a solidly argued multi-year equipment programme. A well-exposed plane on an end-of-life roof becomes a combined renovation-plus-photovoltaic project; a roof promising on paper can be disqualified by its condition, which only the prior survey reveals — see our roof survey before solar panels guide.
The second use is civic: publish the map so every resident can look up their roof's potential, support energy-community or collective self-consumption projects, ground the debates in fact. The register then joins the energy chapter of the local climate plan, alongside the inverse diagnosis — heat losses — covered by our municipal aerial thermography guide: same overall flights, two complementary readings of the same building stock.
Prices observed in 2026
Ranges observed in 2026 (excl. VAT):
- Town centre up to 100 ha (flight, DSM, orthophoto, irradiation map, public-roof ranking): €3,000 to €6,000.
- Municipality of 100 to 500 built-up ha: €6,000 to €12,000 depending on density and restricted zones.
- Public-buildings chapter alone (10 to 30 municipal buildings, per-site sheets): €1,500 to €3,500.
- Periodic update (re-flying the zones that change): tapering rate on the re-flown footprint.
These amounts stay below the cost of a single poorly targeted feasibility study: the register exists precisely to launch studies only on the right sites. Purchasing follows the frameworks in our guide to public procurement of drone services; request a quote stating the built-up footprint, airspace constraints and intended use (internal, publication).
Frequently asked questions
How does a drone register differ from existing online solar registers?
By the input data: regional registers rest on aerial campaigns years apart and on decimetre-to-metre resolutions. The drone flight provides a current-year model at a few centimetres, where dormers, plant rooms and actual trees are accounted for — and the municipality owns the data, reusable for its other GIS needs.
Does the register directly give an installation's profitability?
No: it provides irradiation and an estimated yield per plane — that is, a reliable ranking of sites. Profitability then depends on consumption profile, tariff, grid connection and roof condition — all matters for the feasibility study, to be launched on the sites the register has put at the top of the list.
Put it into practice
- Drone roof inspection: rates and cities covered from €200
- Roof inspection in Saint-Malo Bretagne
- Roof inspection in Châteauroux Centre-Val de Loire
- Roof inspection in Gap Provence-Alpes-Côte d'Azur