A professional drone pilot for this mission Request a free quote
C-DRONE GUIDE · 30 JULY 2026
Municipal aerial thermography by drone: roof heat loss mapping, price
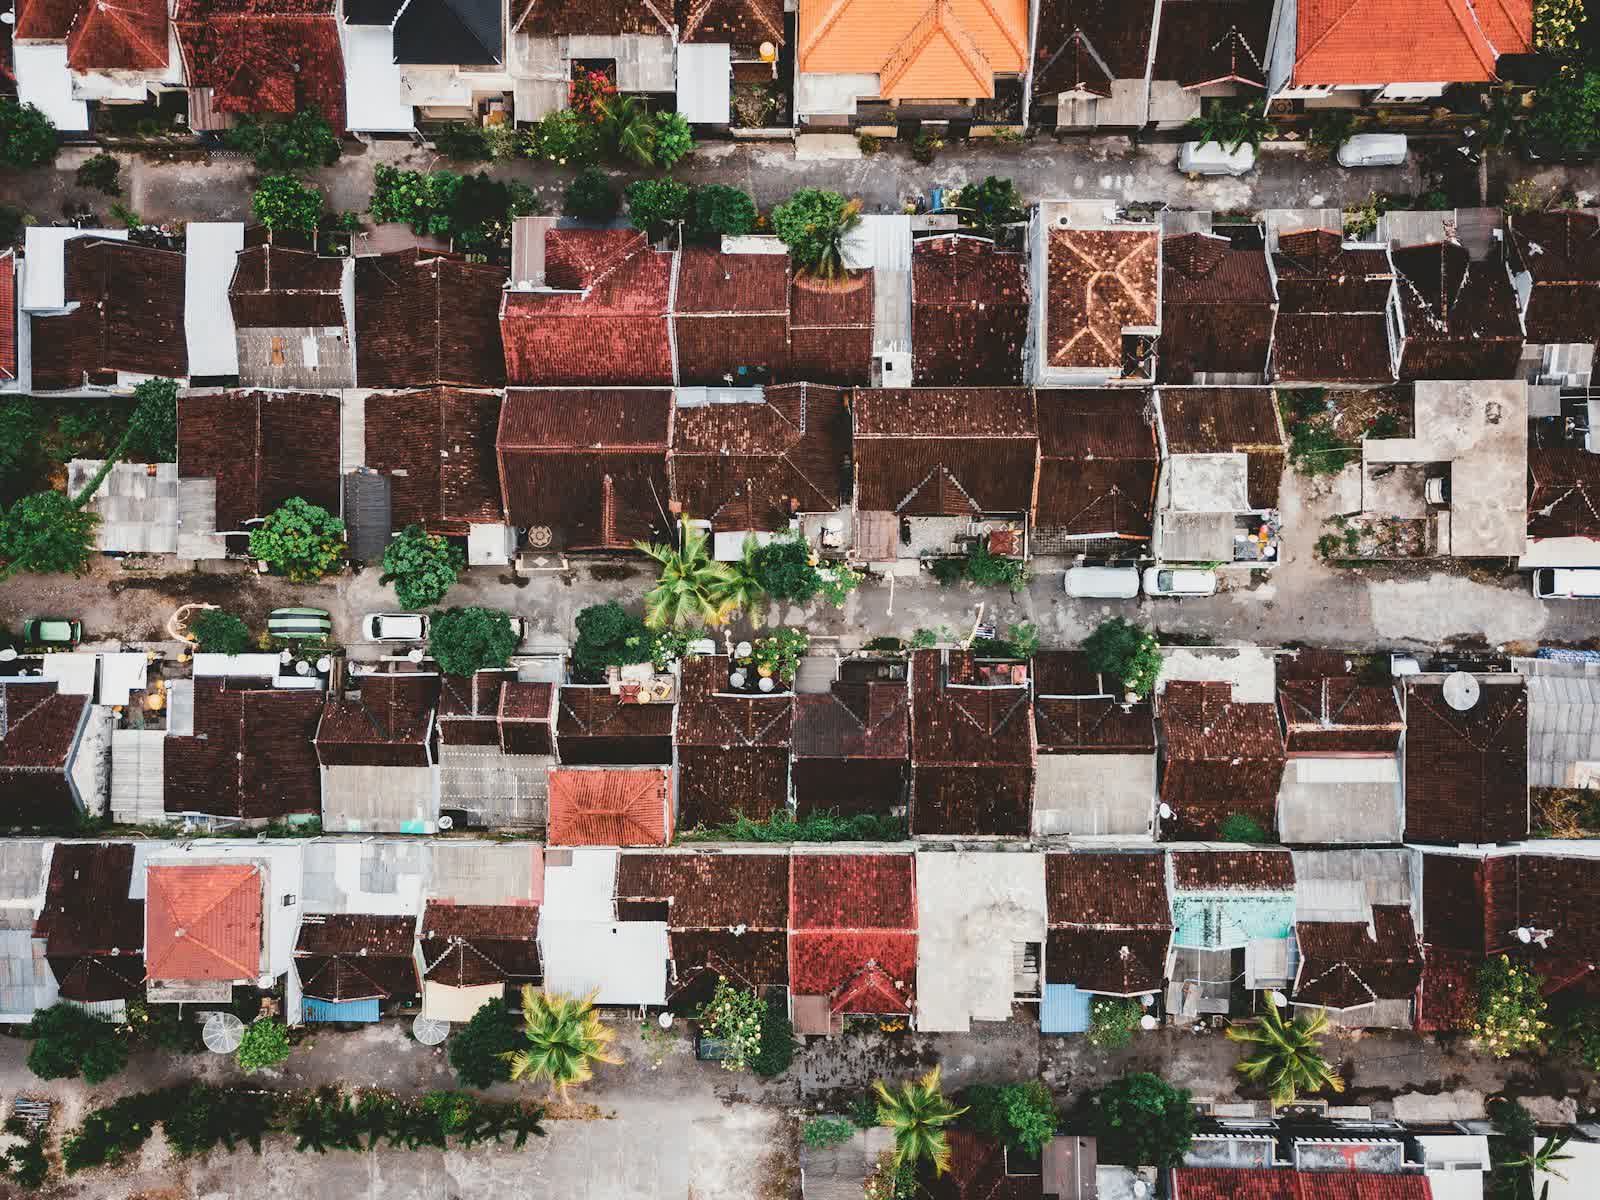
In the 2010s, entire French conurbations had their territory overflown by aircraft to produce roof heat-loss maps — spectacular, costly campaigns reserved for large metropolitan areas. Drones have changed the scale of the problem: a town of a few thousand inhabitants, a village centre, a priority neighbourhood or a historic core can now be thermally mapped over a few winter nights, on a budget within reach of an average municipality or inter-municipal body. The goal is not to point fingers at thermal sieves — it is to give residents a telling image of their own roof and to feed renovation support schemes. Here is how a municipal campaign is set up, what the images really show, and prices observed in 2026.
Published on 30 July 2026, updated on 22 September 2026 — regulations in force as of September 2026.
From aircraft to drone: the same product, another scale
The principle has not changed: overfly a built-up area during the heating season with a thermal camera and deliver, roof by roof, a map of apparent surface temperatures — the warmest roofs seen from the sky being, all else equal, those leaking heat from the heated dwelling below. What has changed is the vehicle: where aircraft required a massive campaign amortised over tens of thousands of roofs, the drone works at the scale of a village, a 1970s housing estate or a historic centre, at far higher resolution — a few centimetres per pixel, enough to tell a poorly insulated roof slope from a chimney stack.
For a municipality, the campaign is designed by coherent sectors: the historic core with its complex roofs, homogeneous suburban neighbourhoods, municipal buildings — which deserve their own report and join the asset-management logic of our school roof audit guide. The same flights can also feed, in summer, the mapping of urban heat islands: two seasonal campaigns, one contract.
What the camera shows — and its honest limits
A thermal roof image must be read methodically. Conditions first: night or late-night flights, preferably overcast, cold dry air, several hours after any sunshine — otherwise the camera measures yesterday's sun, not the resident's heating. Materials next: slate, clay tile and steel deck emissivities differ, and a cold ventilated roof can hide a poorly insulated attic. A review by Matthew Fox, David Coley, Steve Goodhew and Pieter de Wilde published in 2014 in Renewable and Sustainable Energy Reviews surveys building thermography methodologies and highlights precisely these validity conditions — protocol, weather, interpretation — that separate a useful map from a misleading image (see the study).
Properly run, the campaign delivers a reliable ranking: which blocks, which streets, which roof types concentrate heat loss. It replaces neither a regulatory energy audit nor an EPC — it says where to offer them first, applying at neighbourhood scale the same triage logic our guide on drone thermography for energy renovation applies to a single building.
The real deliverable: renovation engagement
Municipalities that succeed with these campaigns treat them as an engagement tool more than a map: public presentation at the town hall, drop-in sessions where each resident comes to see the thermal thumbnail of their own roof, coordination with the local energy-advice service and, where one exists, with the local renovation aid programme. The thermal image triggers what years of leaflets never achieve: the advice visit, then the works file. Individual results are shared at the resident's request — the municipality publishes sector-level summaries, never a name-by-name ranking.
This part carries a few precautions: informing the population beforehand (municipal bulletin, notices), flights compliant with the built-up area framework, camera aimed at roofs and data handled under the rules recalled in our GDPR and professional drones guide. For procurement, the campaign fits a standard consultancy contract — see our guide on buying drone services under public procurement.
Extending the campaign: networks and public buildings
Once the pilot is on site and winter conditions are right, the flying night pays for itself. Municipalities with a district heating network have the drone follow the route: buried hot-water leaks draw characteristic linear anomalies, a method detailed in our district heating leak detection guide. Public buildings — town hall, schools, village hall, gymnasium — receive close-range thermography feeding their tertiary decree trajectory where they fall under it.
Finally, the area's condominiums and social landlords are natural relays: the thermal thumbnail of their building gets the topic onto the agenda, and the process continues with the dedicated survey described in our collective EPC and works plan guide. The municipal campaign then plays its true role: triggering, across the territory, renovation decisions that are taken building by building.
Prices observed in 2026
Ranges observed in 2026 (excl. VAT):
- Neighbourhood or village up to 500 roofs (winter night flights, per-roof thermal map): €1,800 to €3,500.
- Municipality of 2,000 to 5,000 inhabitants (several sectors, per-block reporting): €3,500 to €7,000.
- Engagement option (individual thumbnails, public presentation material): €800 to €1,500.
- District heating or municipal buildings extension (same campaign): €500 to €1,500 per module.
The schedule is weather-bound: the winter window is booked from autumn. Our thermal imaging drone page presents the service; request a quote stating the intended perimeter, approximate roof count and any local renovation aid scheme.
Put it into practice
- Drone roof inspection: rates and cities covered from €200
- Drone aerial thermal imaging: rates and cities covered from €500
- Roof inspection in Dijon Bourgogne-Franche-Comté
- Roof inspection in Le Mans Pays de la Loire
- Roof inspection in Perpignan Occitanie